Property investment stats for Bexley, Greater London
A complete guide to property investment in Bexley.
Last updated: 11 May 2026
Investment summary
Bexley stands out for its strong owner-occupier profile, sitting in the 96th percentile for owner-occupied homes, which underpins long-term stability and a reliable local market. The area’s property market is supported by a predominance of families — Bexley is in the 93rd percentile for family households — suggesting steady demand for larger homes and a stable rental base. While the average rental yield of 5.5% may not be the highest in London, it remains attractive for those seeking income alongside capital preservation. The price-to-income ratio of 7.3 and rent-to-income ratio of 28.0% are typical for London, reflecting the city’s usual affordability pressures.
Liquidity appears healthy, with properties spending an average of 51 days on the market and annual sales at 310. The median price per square foot stands at £505 per sq ft, and the achieved price is close to asking, with a median difference of £3,985 (the typical achieved discount).

Key investment stats for Bexley
Median price per sq ft
£505 / sq ft
Average rental yield
5.5%
Capital growth (1y)
-0.1%
Sales in past year
310
* Property stats calculated for last full calendar year (2024).
Live property stats in Bexley
Live prices in Bexley, Greater London
* Extreme prices clipped for legibility
Properties for sale
Median price
£540,000
25% of properties below...
£400,000
75% of properties below...
£725,000
Most expensive property
£2,200,000
Live listings
179
Median days on market
51
Should you invest in Bexley?
Opportunities
- The top postcode district delivers a notably strong rental yield of 7.8%, which may appeal to investors seeking higher income returns.
- Family demand is robust, as shown by the 93rd percentile ranking for families, supporting steady occupancy for larger homes.
- The median asking rent for a 3-bedroom house is £2,300, indicating solid rental income potential in the family segment.
Risks
- Capital growth over the past year has changed by -0.1%, suggesting limited short-term appreciation.
- The private rented sector is in the 9th percentile, so rental stock is relatively scarce, potentially limiting opportunities to scale a portfolio.
- Affordability remains stretched, with a price-to-income ratio of 7.3, which could constrain future price growth if incomes do not keep pace.
Outlook
Bexley’s outlook is shaped by its stable owner-occupier base and strong demand from families, which should help underpin both sales and lettings. While the annualised growth over three years is 2.9%, the most recent year has seen capital values change by -0.1%, so capital appreciation may be subdued in the short term. However, the long-term stability and reliable rental yields of 5.5% provide a foundation for steady income returns.
Liquidity remains healthy, and the achieved-minus-asking price gap of £3,985 (the typical achieved discount) suggests sellers are realistic and deals are being done close to expectations. For investors with a focus on income and long-term resilience rather than quick capital gains, Bexley’s fundamentals remain reassuring.
Property market trends in Bexley
Average yield (%)
Median price per sq ft (£/sq ft)
Live properties in Bexley
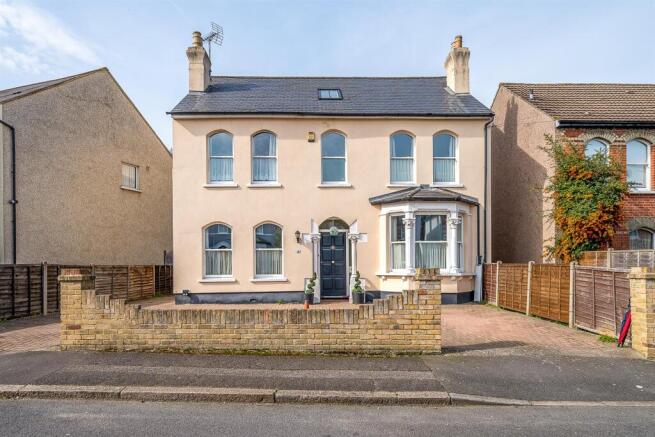
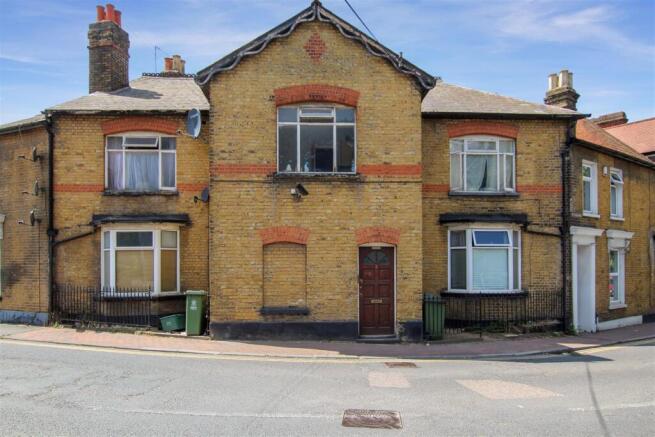
Investment properties in Bexley, Greater London
£1,000,000 - Offers in Excess of
6 bedroom detached house for sale
Knoll Road, Bexley

£390,000
3 bedroom terraced house for sale
Baldwyns Road, Bexley
£725,000 - Guide Price
5 bedroom house for sale
North Cray Road, Bexley Village

£730,000
4 bedroom semi-detached house for sale
Beechway, Bexley

£350,000 - Offers Over
2 bedroom flat for sale
Upton Road South, Bexley, DA5 1QR
Achieved vs asking prices
Key takeaway: Seller's market
Vendors are holding firm; properties tend to sell at close to asking.
Headline stats
• Median discount: £3,985
• 1 in 4 properties sell at > £10,375 below asking
• 1 in 10 properties sell at > £16,650 below asking
In percentage terms:
• Median discount of 0.7%
• 25% of properties discounted by > 2.1%
• 10% of properties discounted by > 3.9%
Best places to invest in Bexley
Top postcodes for rental yield and (annualised) capital growth
Nearby and related areas
Data sources
GeoGlider calculates property investment stats by blending official and proprietary datasets. Here's a quick overview of key sources and how we use them:
HM Land Registry: Property transaction and sold-price records for England & Wales used to calculate historical capital growth, price levels and comparables.
Office for National Statistics (ONS): Demographic and economic indicators for the UK, including Census 2021, supporting area profiling and market context.
Ordnance Survey: Authoritative UK geospatial data powering accurate boundaries, roads and terrain for mapping and spatial analysis.
GeoProp: Our proprietary AI pipeline that processes millions of property listings to extract rich features and live market signals.
Department for Levelling Up, Housing & Communities: Energy Performance Certificate (EPC) scores and property floor areas.
HM Revenue & Customs (HMRC): Household income and employment data to understand local affordability and economic conditions.
Data is updated continuously, matched across sources and rigorously validated.