Property investment stats for West End (Eastleigh), South East
A complete guide to property investment in West End.
Last updated: 25 March 2026
Investment summary
West End sits quietly on the edge of Eastleigh, offering a blend of stability and modest growth for investors. The market here has shown resilience, with capital growth over the past three years of 6.2% and a steady annualised growth of 2.0%. Homes tend to sell within a reasonable timeframe, averaging 54 days. The area is dominated by owner-occupiers, sitting in the 86th percentile for this metric, which reinforces a sense of community and reduces volatility.

Key investment stats for West End
Median price per sq ft
£373 / sq ft
Average rental yield
4.1%
Capital growth (1y)
0.1%
Sales in past year
160
* Property stats calculated for last full calendar year (2024).
Live property stats in West End
Live prices in West End (Eastleigh), South East
* Extreme prices clipped for legibility
Properties for sale
Median price
£375,000
25% of properties below...
£260,000
75% of properties below...
£500,000
Most expensive property
£925,000
Live listings
81
Median days on market
54
Should you invest in West End?
Opportunities
- The average rental yield of 4.1% is attractive for those seeking reliable income, and the top postcode district yield of 6.5% is even more compelling for focused investors.
- With the median sale price for a 3-bedroom house at £395,000 and a median rent of £1,700, there is a clear opportunity to capture family tenants looking for stability.
- The price-to-income ratio of 5.2 suggests homes remain accessible to local buyers, supporting long-term demand.
Risks
- The market is not especially liquid, with only 160 sales annually, which may limit exit options for investors in a hurry.
- The median discount of £2,500 (the typical achieved discount) signals buyers have some negotiation power, so sellers may need to be patient or flexible.
- The area has a relatively high proportion of older residents (81st percentile for age 60+), which could affect long-term demographic trends and demand patterns.
Outlook
Looking ahead, I expect West End to remain a stable if unspectacular performer for property investors. The capital growth over the past year of 0.1% is modest, but the underlying fundamentals — like strong owner-occupier presence and affordability — should underpin steady demand. The rental market is likely to stay healthy, especially for family homes, given the area's high percentage of couples and accessible price-to-income ratio.
Liquidity may remain a challenge, so investors should be prepared for longer hold periods or slower sales. Overall, West End offers a reassuring environment for cautious investors who value stability over rapid gains.
Property market trends in West End
Average yield (%)
Median price per sq ft (£/sq ft)
Live properties in West End
Investment properties in West End (Eastleigh), South East

£349,950
3 bedroom detached bungalow for sale
West End, Southampton
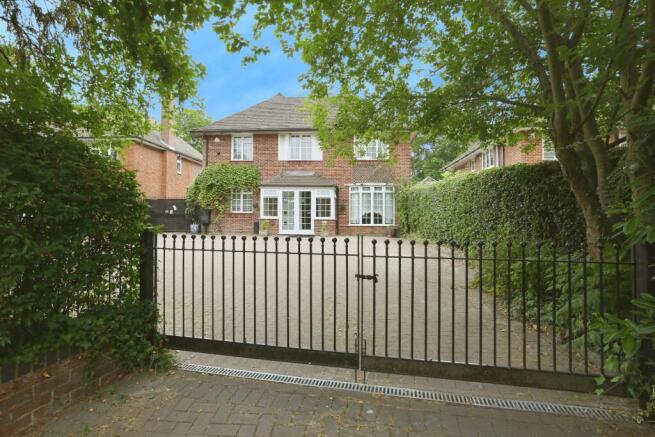
£795,000
4 bedroom detached house for sale
Chalk Hill, West End

£120,000 - Guide Price
2 bedroom maisonette for sale
Sharon Road, West End, Southampton

£400,000 - Offers in Excess of
3 bedroom semi-detached house for sale
Sharon Road, West End, SO30

£375,000 - Offers in Excess of
3 bedroom apartment for sale
Botley Road, West End, SO30
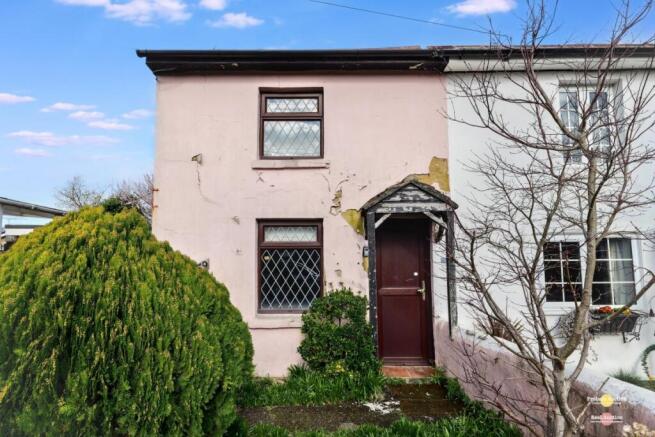
£165,000 - Guide Price
2 bedroom end of terrace house for sale
59 Chapel Road, West End, Southampt...
Achieved vs asking prices
Key takeaway: Seller's market
Vendors are holding firm; properties tend to sell at close to asking.
Headline stats
• Median discount: £2,500
• 1 in 4 properties sell at > £7,450 below asking
• 1 in 10 properties sell at > £14,180 below asking
In percentage terms:
• Median discount of 1.0%
• 25% of properties discounted by > 2.6%
• 10% of properties discounted by > 3.8%
Best places to invest in West End
Top postcodes for rental yield and (annualised) capital growth
Nearby and related areas
Data sources
GeoGlider calculates property investment stats by blending official and proprietary datasets. Here's a quick overview of key sources and how we use them:
HM Land Registry: Property transaction and sold-price records for England & Wales used to calculate historical capital growth, price levels and comparables.
Office for National Statistics (ONS): Demographic and economic indicators for the UK, including Census 2021, supporting area profiling and market context.
Ordnance Survey: Authoritative UK geospatial data powering accurate boundaries, roads and terrain for mapping and spatial analysis.
GeoProp: Our proprietary AI pipeline that processes millions of property listings to extract rich features and live market signals.
Department for Levelling Up, Housing & Communities: Energy Performance Certificate (EPC) scores and property floor areas.
HM Revenue & Customs (HMRC): Household income and employment data to understand local affordability and economic conditions.
Data is updated continuously, matched across sources and rigorously validated.