Property investment stats for Verwood, South West
A complete guide to property investment in Verwood.
Last updated: 25 March 2026
Investment summary
Verwood sits quietly in the South West, drawing in those who favour a slower pace and a strong sense of community. The area has a high rate of owner-occupation, with the owner-occupied housing figure in the 97th percentile, and couples making up a strikingly large share of households. This is not a hotspot for young professionals or students, with both groups sitting in the lowest percentiles, making it a more mature and settled market. Property prices reflect this, with a median price per square foot of £396 per sq ft, and a price-to-income ratio of 6.4, suggesting a degree of affordability compared to trendier urban centres.

Key investment stats for Verwood
Median price per sq ft
£396 / sq ft
Average rental yield
3.1%
Capital growth (1y)
-5.1%
Sales in past year
201
* Property stats calculated for last full calendar year (2024).
Live property stats in Verwood
Live prices in Verwood, South West
* Extreme prices clipped for legibility
Properties for sale
Median price
£480,000
25% of properties below...
£382,500
75% of properties below...
£594,000
Most expensive property
£1,850,000
Live listings
143
Median days on market
71
Should you invest in Verwood?
Opportunities
- The top postcode district offers a rental yield of 3.1%, which is consistent with the area average, making it a stable if not spectacular choice for income-focused investors.
- With a median discount of £5,000 (the typical achieved discount) on sales, buyers may find room to negotiate and secure better deals than in more competitive markets.
- The annual sales volume of 201 and days on market at 71 days suggest reasonable liquidity for those looking to enter or exit the market without undue delay.
Risks
- One-year capital growth has changed by -5.1%, which may give pause to investors seeking short-term appreciation.
- The rental market is relatively small, with private rented housing only in the 19th percentile, so finding tenants may take longer than in more urbanised areas.
- Rental yields are modest at 3.1%, so investors relying on strong cash flow should temper expectations.
Outlook
Verwood’s appeal is likely to remain with families and older couples, given the high proportion of these groups and a population aged 60 and over in the 85th percentile. The market is unlikely to see a dramatic influx of younger renters or students, so growth will probably follow a steady rather than spectacular path.
While capital growth over three years stands at 8.6%, annualised at 2.8%, recent changes show some volatility. However, the combination of reasonable affordability, a stable owner-occupier base, and moderate liquidity should help underpin values. Investors with a long-term perspective and realistic yield expectations will find Verwood a safe, if unspectacular, addition to their portfolio.
Property market trends in Verwood
Average yield (%)
Median price per sq ft (£/sq ft)
Live properties in Verwood
Investment properties in Verwood, South West

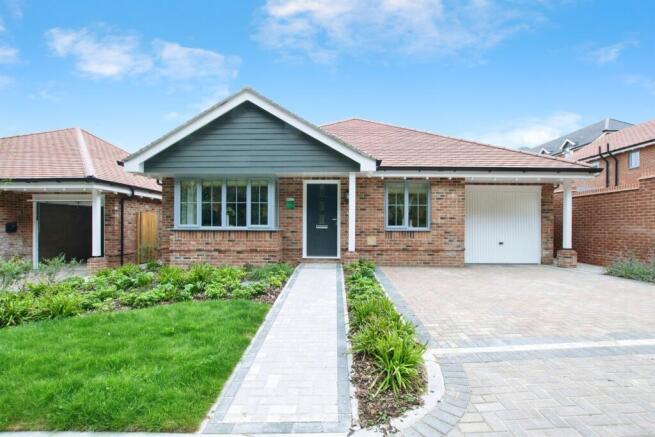
£475,000 - Guide Price
3 bedroom detached bungalow for sale
Sherwood Drive | Verwood | BH31
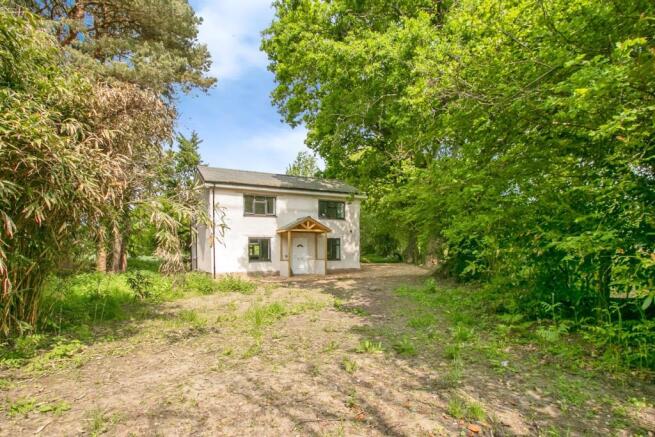
£550,000
3 bedroom detached bungalow for sale
Edmondsham Road, Verwood
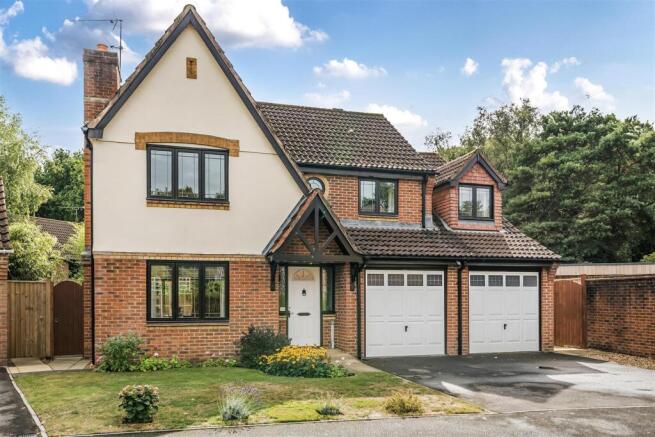
£600,000 - Guide Price
3 bedroom detached house for sale
Margards Lane, Verwood, Dorset, BH3...

£700,000
5 bedroom detached house for sale
Albion Way, Verwood, Dorset, BH31
£525,000 - Offers Over
5 bedroom detached house for sale
Liederbach Drive, Verwood
Achieved vs asking prices
Key takeaway: Balanced market
Discounts exist, but they won't transform deal economics on their own.
Headline stats
• Median discount: £5,000
• 1 in 4 properties sell at > £15,000 below asking
• 1 in 10 properties sell at > £25,000 below asking
In percentage terms:
• Median discount of 1.7%
• 25% of properties discounted by > 3.6%
• 10% of properties discounted by > 4.8%
Best places to invest in Verwood
Top postcodes for rental yield and (annualised) capital growth
Nearby and related areas
Data sources
GeoGlider calculates property investment stats by blending official and proprietary datasets. Here's a quick overview of key sources and how we use them:
HM Land Registry: Property transaction and sold-price records for England & Wales used to calculate historical capital growth, price levels and comparables.
Office for National Statistics (ONS): Demographic and economic indicators for the UK, including Census 2021, supporting area profiling and market context.
Ordnance Survey: Authoritative UK geospatial data powering accurate boundaries, roads and terrain for mapping and spatial analysis.
GeoProp: Our proprietary AI pipeline that processes millions of property listings to extract rich features and live market signals.
Department for Levelling Up, Housing & Communities: Energy Performance Certificate (EPC) scores and property floor areas.
HM Revenue & Customs (HMRC): Household income and employment data to understand local affordability and economic conditions.
Data is updated continuously, matched across sources and rigorously validated.