Property investment stats for Ferndown, South West
A complete guide to property investment in Ferndown.
Last updated: 25 March 2026
Investment summary
Ferndown is a mature, owner-occupied market with a clear tilt toward older residents; the area sits in the 99th percentile for population aged 60 and over, and has almost no student presence. The private rented sector is limited, with owner-occupation in the 96th percentile and private rentals in the 14th percentile. Asking prices are relatively high, with a median price per sq ft of £400 per sq ft, and affordability is stretched, shown by a price-to-income ratio of 7.0. Liquidity is steady, with annual sales at 250 and homes spending a median of 73 days on the market. Rental yields are modest, with an average of 3.2%, though the best-performing postcode district sees yields up to 4.3%.

Key investment stats for Ferndown
Median price per sq ft
£400 / sq ft
Average rental yield
3.2%
Capital growth (1y)
-0.4%
Sales in past year
250
* Property stats calculated for last full calendar year (2024).
Live property stats in Ferndown
Live prices in Ferndown, South West
* Extreme prices clipped for legibility
Properties for sale
Median price
£500,000
25% of properties below...
£325,000
75% of properties below...
£650,000
Most expensive property
£1,950,000
Live listings
225
Median days on market
73
Should you invest in Ferndown?
Opportunities
- Investors seeking stability may appreciate the high owner-occupation rate and the low unemployment rate, which sits in the 3rd percentile nationally.
- There is a notable discount on sales, with a median achieved-minus-asking price of £10,000 (the typical achieved discount), which could present negotiation opportunities.
- The top postcode district offers a higher rental yield at 4.3%, which stands out compared to the area average.
Risks
- Rental demand may be limited given the low proportion of private renters and the very low population of young adults and students.
- Affordability is a challenge, with the price-to-income ratio at 7.0 and the rent-to-income ratio at 26.4%, which may constrain both buyer and tenant pools.
- Capital growth has been flat over the past year, with 1-year capital growth of -0.4%, suggesting subdued short-term prospects.
Outlook
Ferndown looks set to continue as a stable, slow-moving market, underpinned by its older demographic and high levels of owner-occupation. The three-year capital growth is a respectable 11.4%, with an annualised rate of 3.7%, but the recent 1-year capital growth of -0.4% hints at a plateau.
Liquidity should remain reasonable, as shown by annual sales of 250 and homes taking a median of 73 days to sell. Investors should not expect rapid rental growth or a surge in demand from younger renters, but there may be scope for value if negotiating below asking price. Overall, Ferndown offers a calm, predictable investment environment, best suited to those prioritising stability over fast returns.
Property market trends in Ferndown
Average yield (%)
Median price per sq ft (£/sq ft)
Live properties in Ferndown
Investment properties in Ferndown, South West
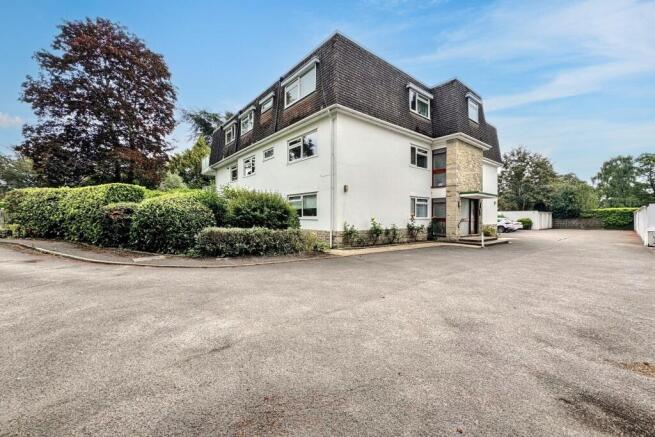
£525,000 - Guide Price
4 bedroom detached house for sale
Kingsway, Ferndown, BH22
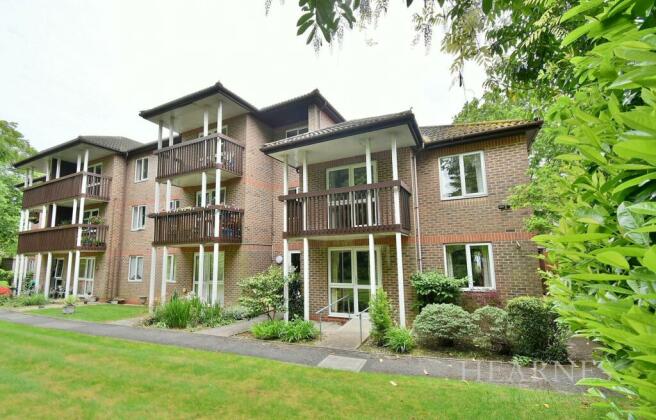
£90,000
1 bedroom retirement property for sale
Fernlea Avenue, Ferndown, BH22
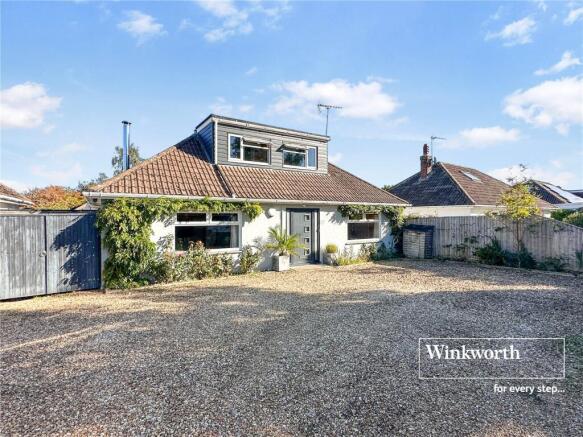
£1,500,000 - Offers in Region of
4 bedroom detached house for sale
Pringles Drive, Ferndown

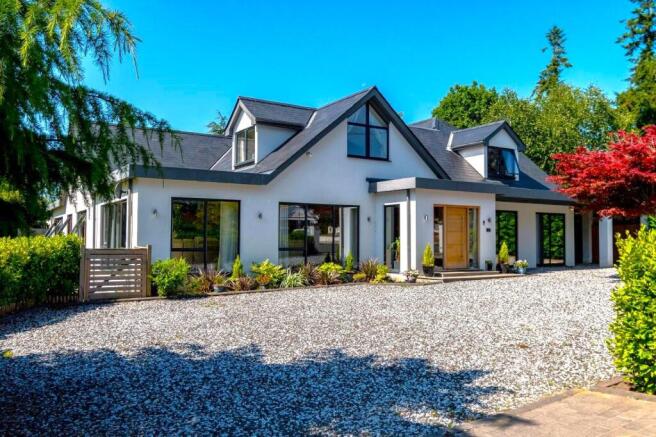
£60,000
1 bedroom retirement property for sale
Ringwood Road, Ferndown, BH22
Achieved vs asking prices
Key takeaway: Balanced market
Buyers have some negotiation leverage, but not much.
Headline stats
• Median discount: £10,000
• 1 in 4 properties sell at > £16,250 below asking
• 1 in 10 properties sell at > £29,600 below asking
In percentage terms:
• Median discount of 2.0%
• 25% of properties discounted by > 4.6%
• 10% of properties discounted by > 7.8%
Best places to invest in Ferndown
Top postcodes for rental yield and (annualised) capital growth
Nearby and related areas
Data sources
GeoGlider calculates property investment stats by blending official and proprietary datasets. Here's a quick overview of key sources and how we use them:
HM Land Registry: Property transaction and sold-price records for England & Wales used to calculate historical capital growth, price levels and comparables.
Office for National Statistics (ONS): Demographic and economic indicators for the UK, including Census 2021, supporting area profiling and market context.
Ordnance Survey: Authoritative UK geospatial data powering accurate boundaries, roads and terrain for mapping and spatial analysis.
GeoProp: Our proprietary AI pipeline that processes millions of property listings to extract rich features and live market signals.
Department for Levelling Up, Housing & Communities: Energy Performance Certificate (EPC) scores and property floor areas.
HM Revenue & Customs (HMRC): Household income and employment data to understand local affordability and economic conditions.
Data is updated continuously, matched across sources and rigorously validated.