Property investment stats for Snodland, South East
A complete guide to property investment in Snodland.
Last updated: 11 May 2026
Investment summary
Snodland offers a balanced property market with a focus on family homes and a strong owner-occupier presence. The area’s median price per square foot is £374 per sq ft, and properties are typically selling with no median discount, as shown by the £0 (the typical achieved discount) figure. Demand appears steady, with homes spending an average of 56 days on the market and annual sales at 160. Affordability is a key strength here, with a price-to-income ratio of 5.2 and a rent-to-income ratio of 28.2%.
The local population skews towards couples and families, both in the 80th percentile nationally, making Snodland particularly appealing for investors targeting these groups. The private rental sector is smaller than average, but owner-occupation is above the national midpoint, supporting stable long-term demand.

Key investment stats for Snodland
Median price per sq ft
£374 / sq ft
Average rental yield
5.2%
Capital growth (1y)
-3.4%
Sales in past year
160
* Property stats calculated for last full calendar year (2024).
Live property stats in Snodland
Live prices in Snodland, South East
* Extreme prices clipped for legibility
Properties for sale
Median price
£325,000
25% of properties below...
£275,000
75% of properties below...
£435,000
Most expensive property
£4,850,000
Live listings
156
Median days on market
56
Should you invest in Snodland?
Opportunities
- Rental yields are solid, with an average of 5.2% and the top postcode district achieving 5.2%.
- Properties are selling at or above asking price, as indicated by the £0 (the typical achieved discount) figure, suggesting strong buyer demand.
- The area’s affordability, with a price-to-income ratio of 5.2, may attract both first-time buyers and renters looking to settle long term.
Risks
- Capital growth over the past year has changed by -3.4%, highlighting potential volatility in short-term values.
- The private rental sector is in the 22nd percentile, so investors may find fewer opportunities compared to areas with a larger rental market.
- The student and degree-educated populations are both in the bottom 15th percentile, which may limit demand from younger or more transient tenants.
Outlook
Looking ahead, Snodland’s property market is likely to remain steady, thanks to its strong appeal to families and couples. The annualised growth over three years is 2.4%, indicating moderate but consistent capital appreciation for those with a longer investment horizon. Rental demand should continue to be supported by the area’s affordability and the solid yield of 5.2%.
While short-term capital growth has changed by -3.4%, the three-year growth figure of 7.3% suggests resilience. Liquidity remains healthy, with properties selling in an average of 56 days. Overall, Snodland offers a mildly positive outlook for investors who value stability and reliable rental returns.
Property market trends in Snodland
Average yield (%)
Median price per sq ft (£/sq ft)
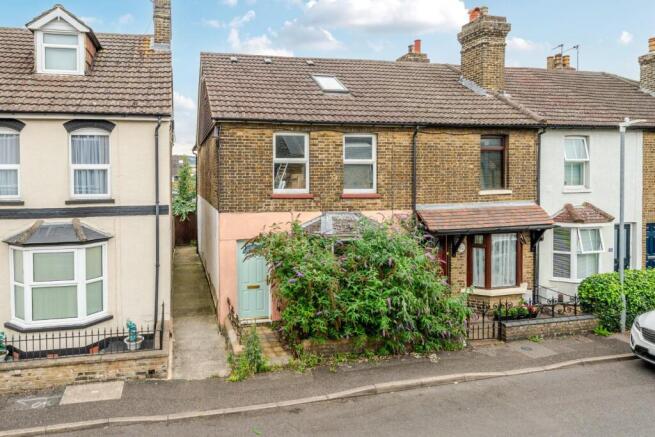
Live properties in Snodland
Investment properties in Snodland, South East

£275,000
2 bedroom terraced house for sale
Holborough Road, Snodland
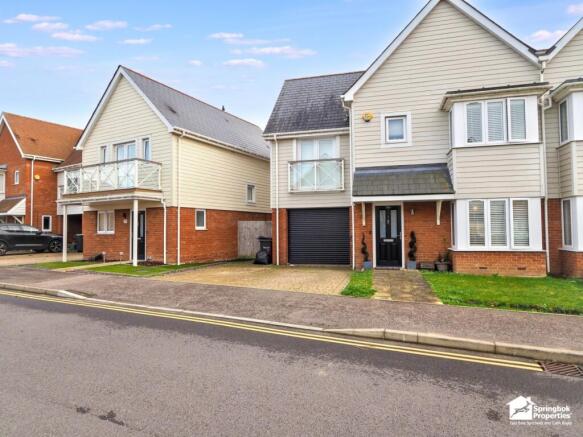
£435,000 - Offers in Excess of
4 bedroom semi-detached house for sale
Manley Boulevard, Snodland, Kent

£220,000 - Guide Price
2 bedroom flat for sale
Poynder Drive, Snodland, ME6

£285,000
3 bedroom terraced house for sale
Simpson Road, Snodland
£365,000 - Guide Price
4 bedroom end of terrace house for sale
Church Field, Snodland

£150,000 - Guide Price
1 bedroom apartment for sale
High Street, Snodland, Kent
Achieved vs asking prices
Key takeaway: Seller's market
Buyers should not expect big bargains — discounts are marginal.
Headline stats
• Median discount: £0
• 1 in 4 properties sell at > £8,750 below asking
• 1 in 10 properties sell at > £13,000 below asking
In percentage terms:
• Median discount of 0.0%
• 25% of properties discounted by > 2.4%
• 10% of properties discounted by > 5.0%
Best places to invest in Snodland
Top postcodes for rental yield and (annualised) capital growth
Nearby and related areas
Data sources
GeoGlider calculates property investment stats by blending official and proprietary datasets. Here's a quick overview of key sources and how we use them:
HM Land Registry: Property transaction and sold-price records for England & Wales used to calculate historical capital growth, price levels and comparables.
Office for National Statistics (ONS): Demographic and economic indicators for the UK, including Census 2021, supporting area profiling and market context.
Ordnance Survey: Authoritative UK geospatial data powering accurate boundaries, roads and terrain for mapping and spatial analysis.
GeoProp: Our proprietary AI pipeline that processes millions of property listings to extract rich features and live market signals.
Department for Levelling Up, Housing & Communities: Energy Performance Certificate (EPC) scores and property floor areas.
HM Revenue & Customs (HMRC): Household income and employment data to understand local affordability and economic conditions.
Data is updated continuously, matched across sources and rigorously validated.