Property investment stats for Burntwood, West Midlands
A complete guide to property investment in Burntwood.
Last updated: 11 May 2026
Investment summary
Burntwood sits in a pocket of the West Midlands that is quietly steady rather than headline-grabbing. The market here is shaped by a high proportion of owner-occupiers (in the 81st percentile), so the pace of sales is brisk and liquidity is healthy, with homes typically spending 46 days on the market. Families and couples make up a notable share of households, and the area’s affordability is a draw, with a price-to-income ratio of 5.0 and a rent-to-income ratio of 24.0%.
Investors will find the median price per square foot at £274 per sq ft, and a choice of property types, from three-bedroom houses with a median asking price of £295,000 to two-bedroom flats at £200,000. The annual sales volume of 324 signals a market with enough activity to avoid stagnation, but not so much that it feels overheated. Recent capital growth — 1.8% over one year and 8.6% over three — suggests steady, if unspectacular, appreciation.

Key investment stats for Burntwood
Median price per sq ft
£274 / sq ft
Average rental yield
5.3%
Capital growth (1y)
1.8%
Sales in past year
324
* Property stats calculated for last full calendar year (2024).
Live property stats in Burntwood
Live prices in Burntwood, West Midlands
* Extreme prices clipped for legibility
Properties for sale
Median price
£300,000
25% of properties below...
£227,475
75% of properties below...
£400,000
Most expensive property
£1,695,000
Live listings
159
Median days on market
46
Should you invest in Burntwood?
Opportunities
- Rental yields are robust, with an average of 5.3%, and the top postcode district yields 5.2%, making the area attractive for income-focused investors.
- The market offers a consistent median discount of £5,000 (the typical achieved discount), providing room for negotiation and potential value-add.
- Three-bedroom houses and two-bedroom flats are both affordable relative to incomes, with asking prices of £295,000 and £200,000, supporting accessibility for a range of tenants or buyers.
Risks
- The private rented sector is limited (in the 19th percentile), so rental demand may not be as deep as in more transient or urban areas.
- The area skews older, with a population aged 60+ in the 81st percentile, which could temper long-term rental growth or shift demand towards downsizing.
- The degree-educated and professional population is below average (17th and 36th percentiles), which may cap some future capital growth potential.
Outlook
Looking ahead, Burntwood’s property market is likely to remain steady, with measured growth and low volatility. The area’s affordability, combined with a high proportion of owner-occupiers, should support stable prices even if wider market conditions become uncertain. Rental yields are expected to remain attractive, especially given the current average of 5.3%, but investors should be mindful that rental demand may not surge due to the limited private rented sector.
With a median discount of £5,000 (the typical achieved discount) and homes selling in around 46 days, liquidity is strong enough for investors to enter and exit without undue delay. Capital growth is likely to continue at a modest pace, with the three-year annualised rate of 2.8% offering a realistic outlook for those seeking steady rather than spectacular returns.
Property market trends in Burntwood
Average yield (%)
Median price per sq ft (£/sq ft)
Live properties in Burntwood
Investment properties in Burntwood, West Midlands

£175,000 - Offers in Region of
2 bedroom semi-detached house for sale
Oak Lane, Burntwood, WS7 2HD

£170,000
2 bedroom terraced house for sale
Rugeley Road, Chase Terrace, Burntw...
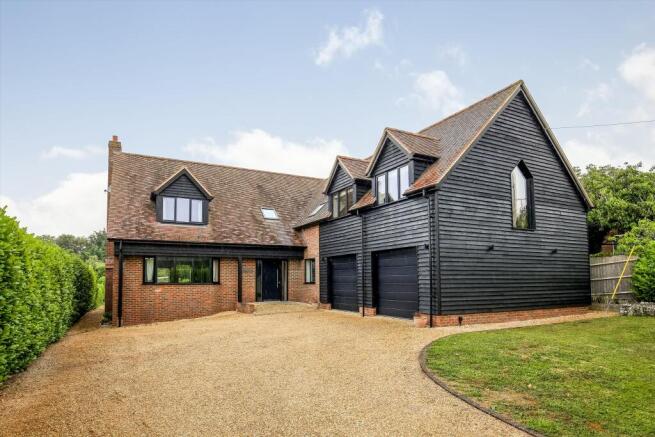
£1,250,000 - Guide Price
5 bedroom detached house for sale
Mount Hermon Road, Palestine, Andov...
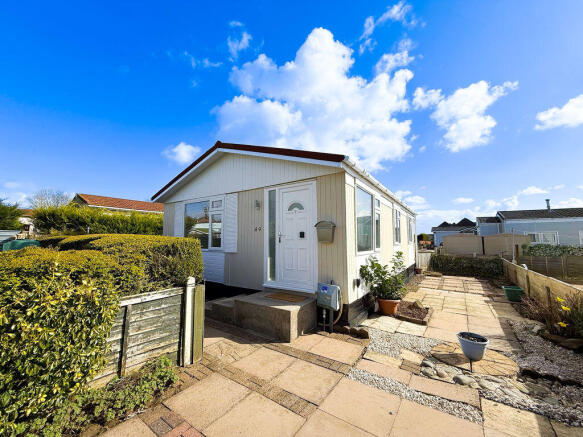
£120,000 - Offers in Region of
2 bedroom park home for sale
Biddulph Park, Burntwood, WS7 1LG
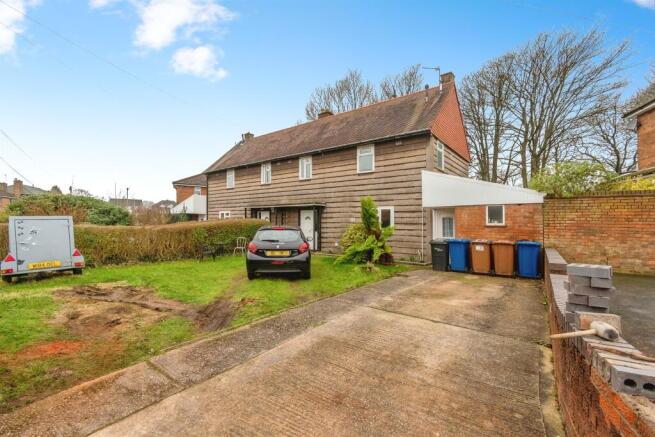
£165,000 - Guide Price
4 bedroom semi-detached house for sale
King Street, Burntwood
Achieved vs asking prices
Key takeaway: Balanced market
Buyers have some negotiation leverage, but not much.
Headline stats
• Median discount: £5,000
• 1 in 4 properties sell at > £8,000 below asking
• 1 in 10 properties sell at > £13,900 below asking
In percentage terms:
• Median discount of 1.8%
• 25% of properties discounted by > 3.0%
• 10% of properties discounted by > 4.4%
Best places to invest in Burntwood
Top postcodes for rental yield and (annualised) capital growth
Nearby and related areas
Data sources
GeoGlider calculates property investment stats by blending official and proprietary datasets. Here's a quick overview of key sources and how we use them:
HM Land Registry: Property transaction and sold-price records for England & Wales used to calculate historical capital growth, price levels and comparables.
Office for National Statistics (ONS): Demographic and economic indicators for the UK, including Census 2021, supporting area profiling and market context.
Ordnance Survey: Authoritative UK geospatial data powering accurate boundaries, roads and terrain for mapping and spatial analysis.
GeoProp: Our proprietary AI pipeline that processes millions of property listings to extract rich features and live market signals.
Department for Levelling Up, Housing & Communities: Energy Performance Certificate (EPC) scores and property floor areas.
HM Revenue & Customs (HMRC): Household income and employment data to understand local affordability and economic conditions.
Data is updated continuously, matched across sources and rigorously validated.