Property investment stats for Streetly, West Midlands
A complete guide to property investment in Streetly.
Last updated: 11 May 2026
Investment summary
Streetly is an area where owner-occupation dominates, sitting in the 99th percentile for this metric, while private and social renting are almost absent by national standards. The market here is relatively liquid, with properties spending a median of 75 days before selling and annual sales at 186, suggesting steady if unspectacular activity. Affordability is reasonable, with a price-to-income ratio of 5.9 and a rent-to-income ratio of 23.9%, both of which are manageable for local buyers and tenants. The median price per square foot stands at £347 per sq ft, while a typical 3-bedroom house is currently listed for £380,000, and a 2-bedroom flat at £194,998.

Key investment stats for Streetly
Median price per sq ft
£347 / sq ft
Average rental yield
3.6%
Capital growth (1y)
-0.0%
Sales in past year
186
* Property stats calculated for last full calendar year (2024).
Live property stats in Streetly
Live prices in Streetly, West Midlands
* Extreme prices clipped for legibility
Properties for sale
Median price
£495,000
25% of properties below...
£345,000
75% of properties below...
£825,000
Most expensive property
£4,795,000
Live listings
173
Median days on market
75
Should you invest in Streetly?
Opportunities
- Investors can find relatively strong rental yields in the top-performing postcode, with yields of 5.2%.
- The area’s high proportion of professionals and managers (in the 83rd percentile) may support demand for quality homes.
- Properties are not lingering on the market, with a median time to sale of 75 days, which may appeal to those seeking liquidity.
Risks
- The private rented sector is almost non-existent here, in the 1st percentile, which limits the pool of potential tenants for buy-to-let investors.
- Capital growth has been modest, with 1-year growth of 0% and annualised 3-year growth of 1.7%, so rapid appreciation is unlikely.
- The population skews older, with those aged 60+ in the 86th percentile, potentially impacting longer-term demand dynamics.
Outlook
Looking ahead, Streetly is unlikely to deliver dramatic price growth, given the 0 percent capital growth over the past year and only 1.7% annualised over three years. This is a mature, stable owner-occupied market, so investors should not expect the volatility or upside seen in more dynamic rental hotspots.
Rental yields in the top-performing postcode are relatively attractive at 5.2%, but the tiny size of the private rented sector means opportunities are limited and competition for tenants could be low. For those who value liquidity, the median time to sale of 75 days and annual sales of 186 suggest a market where you can transact without undue delay.
Overall, Streetly is a safe but unexciting choice for investors, best suited to those seeking stability and a low-risk profile rather than rapid gains.
Property market trends in Streetly
Average yield (%)
Median price per sq ft (£/sq ft)
Live properties in Streetly
Investment properties in Streetly, West Midlands
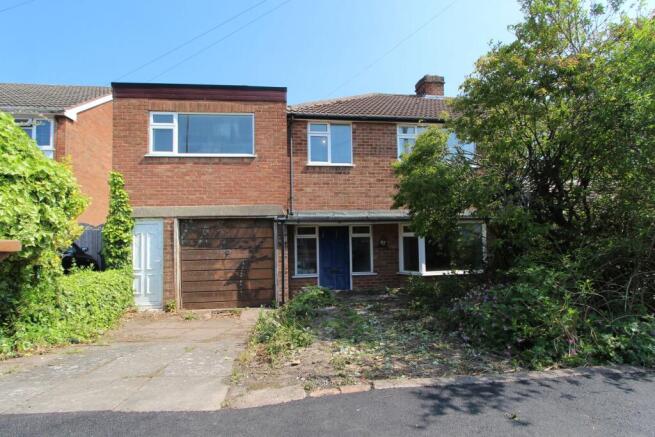
£330,000 - Offers in Region of
4 bedroom semi-detached house for sale
Elmtree Road, Sutton Coldfield, B74
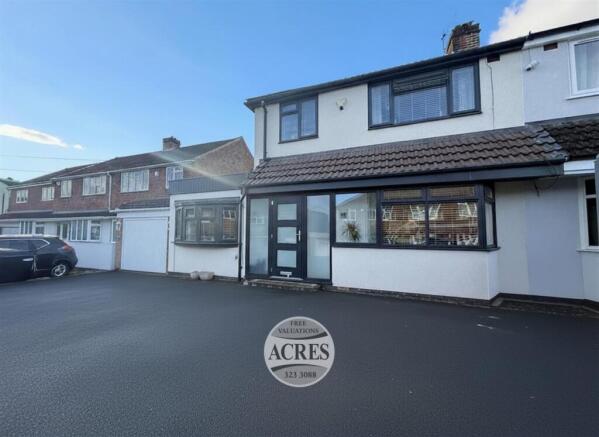
£385,000
3 bedroom semi-detached house for sale
Elmtree Road, Streetly, Sutton Cold...

£1,200,000 - Offers in Region of
4 bedroom detached bungalow for sale
Endwood Drive, Little Aston Park, S...
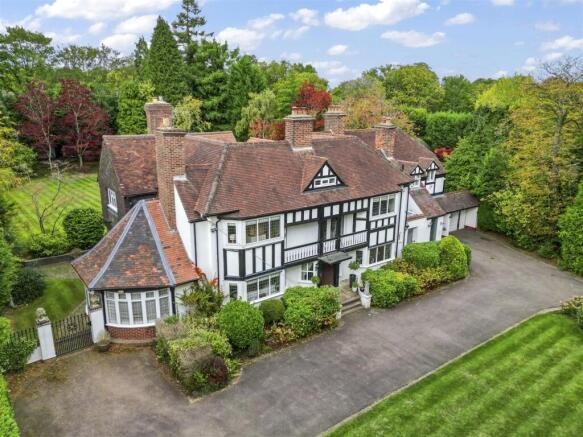
£1,995,000 - Guide Price
5 bedroom detached house for sale
Rosemary Hill Road, Sutton Coldfiel...

£199,995
2 bedroom apartment for sale
Grange Drive, Streetly, Sutton Cold...

£750,000 - Guide Price
4 bedroom detached house for sale
Thornhill Road, Sutton Coldfield
Achieved vs asking prices
Key takeaway: Balanced market
On average, properties sell slightly below asking; careful comp analysis is key.
Headline stats
• Median discount: £5,000
• 1 in 4 properties sell at > £10,000 below asking
• 1 in 10 properties sell at > £20,000 below asking
In percentage terms:
• Median discount of 1.3%
• 25% of properties discounted by > 2.4%
• 10% of properties discounted by > 4.6%
Best places to invest in Streetly
Top postcodes for rental yield and (annualised) capital growth
Nearby and related areas
Data sources
GeoGlider calculates property investment stats by blending official and proprietary datasets. Here's a quick overview of key sources and how we use them:
HM Land Registry: Property transaction and sold-price records for England & Wales used to calculate historical capital growth, price levels and comparables.
Office for National Statistics (ONS): Demographic and economic indicators for the UK, including Census 2021, supporting area profiling and market context.
Ordnance Survey: Authoritative UK geospatial data powering accurate boundaries, roads and terrain for mapping and spatial analysis.
GeoProp: Our proprietary AI pipeline that processes millions of property listings to extract rich features and live market signals.
Department for Levelling Up, Housing & Communities: Energy Performance Certificate (EPC) scores and property floor areas.
HM Revenue & Customs (HMRC): Household income and employment data to understand local affordability and economic conditions.
Data is updated continuously, matched across sources and rigorously validated.