Property investment stats for Waltham, Yorkshire and The Humber
A complete guide to property investment in Waltham.
Last updated: 11 May 2026
Investment summary
Waltham is a village with a mature population and a strong base of owner-occupiers, sitting in the 95th percentile for owner-occupied housing and the 94th percentile for residents aged 60 and over. The area is dominated by couples, with a strikingly high proportion in the 96th percentile, while families and younger adults are less represented. Property prices are relatively accessible, with a price-to-income ratio of 4.6, and the median price per square foot stands at £208 per sq ft. Over the past year, capital growth changed by -3.9%, but the three-year growth figure of 5.7% suggests some resilience over the medium term.

Key investment stats for Waltham
Median price per sq ft
£208 / sq ft
Average rental yield
-
Capital growth (1y)
-3.9%
Sales in past year
146
* Property stats calculated for last full calendar year (2024).
Live property stats in Waltham
Live prices in Waltham, Yorkshire and The Humber
* Extreme prices clipped for legibility
Properties for sale
Median price
£270,000
25% of properties below...
£210,000
75% of properties below...
£419,950
Most expensive property
£1,150,000
Live listings
125
Median days on market
104
Should you invest in Waltham?
Opportunities
- The median sale price for a 3-bedroom house is £250,000, while the median rent for the same property type is £1,000, offering potential for stable rental returns.
- The top postcode district in Waltham delivers a rental yield of 4.4%, which could appeal to investors seeking predictable income.
- With properties taking 104 days to sell and a median discount of £6,250 (the typical achieved discount), buyers may find room to negotiate and secure value.
Risks
- Capital growth over the last year changed by -3.9%, so short-term price appreciation has been limited.
- The area has a low proportion of private renters, in the 8th percentile, which may restrict rental demand for investors focused on buy-to-let.
- Annual sales are just 146, meaning liquidity could be an issue if you need to exit quickly.
Outlook
The coming year in Waltham is likely to be steady rather than spectacular. The area’s high owner-occupation and older demographic mean it is less exposed to volatile swings in demand, but it also means the pool of renters and younger buyers is not large. Affordability remains a positive, with the price-to-income ratio of 4.6 making it accessible for most buyers.
Given the three-year annualised growth rate of 1.9%, investors should expect modest capital appreciation rather than rapid gains. For those seeking stability and income, Waltham’s market offers a calm harbour, but do not expect it to set the world alight. If your strategy is long-term and focused on steady returns, this is an area that could quietly deliver.
Property market trends in Waltham
Average yield (%)
Median price per sq ft (£/sq ft)
Live properties in Waltham
Investment properties in Waltham, Yorkshire and The Humber
£175,000
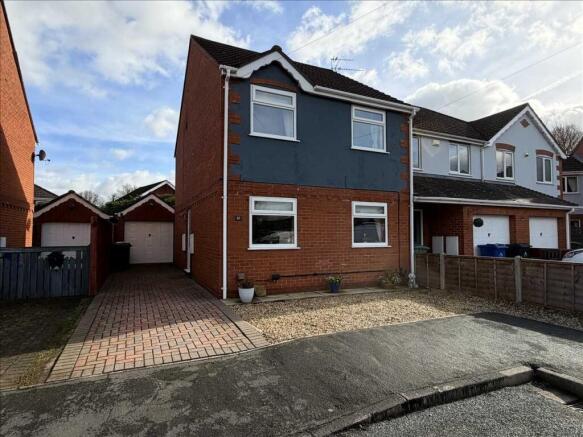
3 bedroom link detached house for sale
GLENEAGLES, WALTHAM, GRIMSBY

£349,950
4 bedroom detached house for sale
Plot 149, 22 Kestrel Drive, Waltham
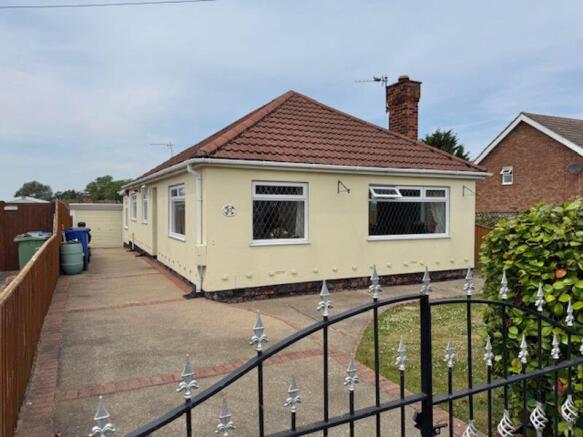
£160,000 - Guide Price
2 bedroom detached bungalow for sale
MANOR DRIVE, WALTHAM

£235,000 - Offers in Region of
2 bedroom semi-detached house for sale
Church Lane, Waltham

£265,000
4 bedroom semi-detached house for sale
Cheapside, Waltham, DN37
Achieved vs asking prices
Key takeaway: Balanced market
On average, properties sell slightly below asking; careful comp analysis is key.
Headline stats
• Median discount: £6,250
• 1 in 4 properties sell at > £11,875 below asking
• 1 in 10 properties sell at > £15,000 below asking
In percentage terms:
• Median discount of 2.6%
• 25% of properties discounted by > 4.9%
• 10% of properties discounted by > 6.7%
Best places to invest in Waltham
Top postcodes for rental yield and (annualised) capital growth
Nearby and related areas
Data sources
GeoGlider calculates property investment stats by blending official and proprietary datasets. Here's a quick overview of key sources and how we use them:
HM Land Registry: Property transaction and sold-price records for England & Wales used to calculate historical capital growth, price levels and comparables.
Office for National Statistics (ONS): Demographic and economic indicators for the UK, including Census 2021, supporting area profiling and market context.
Ordnance Survey: Authoritative UK geospatial data powering accurate boundaries, roads and terrain for mapping and spatial analysis.
GeoProp: Our proprietary AI pipeline that processes millions of property listings to extract rich features and live market signals.
Department for Levelling Up, Housing & Communities: Energy Performance Certificate (EPC) scores and property floor areas.
HM Revenue & Customs (HMRC): Household income and employment data to understand local affordability and economic conditions.
Data is updated continuously, matched across sources and rigorously validated.